top of page


Intelligent
Harvesting
Commissioned

01. Overview
Modern agriculture is increasingly integrating technological innovations to enhance efficiency and productivity. While environmental factors such as temperature and precipitation continue to play a critical role, advancements in precision agriculture, data analytics, and automation are significantly reducing the margin for error. This is where Intelligent Harvesting comes in—a brilliant and innovative startup that relies on data collection during harvest and its analysis. This principle provides a significant advantage in understanding the plots status and planning for the future.
My role
Designing the the desktop interface targeting field owners, utilizing existing raw data and a minimal web-based interface (proof of concept). The outcome is a comprehensive design model that consolidates user needs and proposed solutions into a cohesive UX concept. This model represents a full design version prior to user testing and platform implementation.

02. Problem & Solution
-
Lack of accurate field measurements makes it difficult for farmers to understand field variability and develop effective cultivation plans.
-
Harvest monitoring is performed by external providers, making it difficult to coordinate logistics such as delivery truck timing and track real-time field progress.
-
Real-time sensor-based insights embedded in the harvesting machine give farmers immediate, accurate field data, helping them adjust and optimize cultivation plans effectively.
-
An interface allowing farmers to:
-
Monitor harvesting in real-time.
-
Coordinate directly with stakeholders (harvest contractors, transport, etc.).
-
Analyze post-harvest yield performance independently.
-
Rely on desktop interface for in-depth data analysis and planning.
.
03. Persona
Ori Cohen – An Experienced Farmer
General Profile
Age: 37
Location: Galilee region, Israel
Occupation: Vineyard owner specializing in wine grapes
Experience: 5 years in viticulture, working with wineries and local production facilities
Technological Background: Familiar with smart irrigation systems and modern agricultural tools but finding them a bit challenging.
Challenges and Pain Points
-
Limited control during harvesting
-
Yield variation between vineyard sections
-
Complex systems are discouraging


04. Design process
The research process included surveys and user testing with professionals at the core of the industry, such as farmers, as well as experts from fields where technology and exact sciences have already been integrated as part of daily operations, such as food engineering in production lines.

Wireframes


*
From Data to Insight: Designing the yield per area graph
An example from the design process of the graph that allows control over the display of yield per area, enabling an understanding of growth patterns within the plot.
Client version
-
Lack of clarity regarding numerical representation.
-
No graphical representation of "good" and "bad."
-
No reflection of actual crop yield (users might set the threshold above or below non-existent values).


Highlighting the fluctuations
-
Visually presents the crop yield per meter and allows adjustment of the metrics accordingly.
-
Emphasizes the fluctuations in yield.
-
Creates a cluttered and unclear appearance.


Highlighting the highs and lows
-
Clean and organized appearance.
-
Insufficient contrast.
-
Difficult to identify the exact quantity at the graph’s high and low points.
Final design


05. Final design
Signing in
Simplifying the sign-up process for farmers.

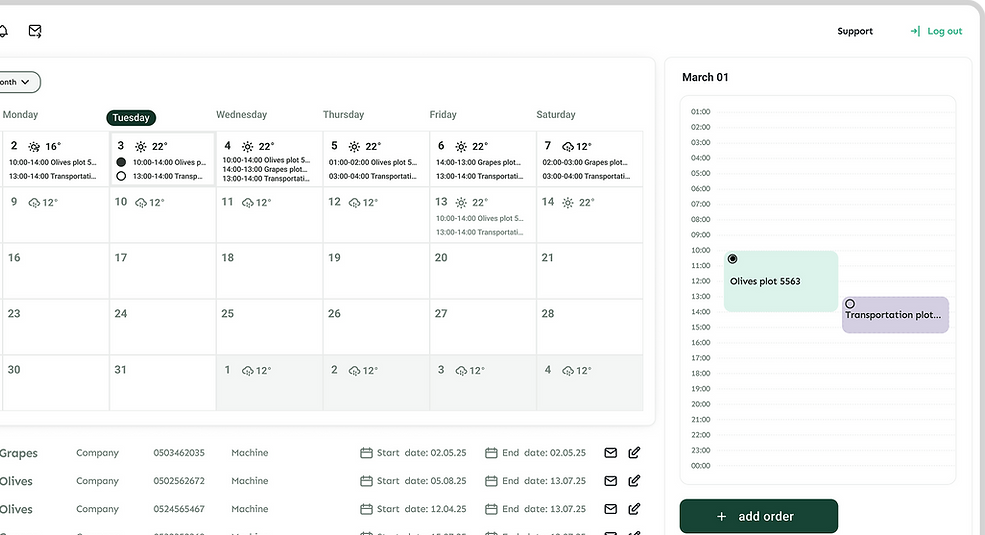
Home page
coordinate logistics
Monitoring the work process
Monitor harvesting in real-time

Comparison and analysis
in-depth data analysis


06. Design system


bottom of page